Investment Alpha and Beta Explained: How to Measure Portfolio Risk and Performance
- bryanjepson
- Aug 18, 2025
- 5 min read
Updated: Oct 14, 2025

In my last article, I pulled back the curtain on expense ratios—those “silent fees” that can drag down your portfolio without you noticing. But keeping costs low is only the first step in smart portfolio management. The next question is: how do you actually measure whether your portfolio is performing well? That’s where alpha and beta come in. These two simple metrics can show you not just how much you earned, but how much risk you took to get there.
Passive vs Active Investors
In my experience, there are two main types of investors.
The first group is the set-and-forget crowd. They simply automate their investments into a targeted-date fund or S&P 500 index and are perfectly happy matching their benchmark, watching their money grow without much thought.
The second group is the try-to-beat-the-market crowd. They believe their choices will give them an edge, and they actively manage at least part of their portfolio.
In short, it is the passive investor vs the active investor. Which one are you?
If you are a passive investor, this article may not interest you much. You are the market—the target against what the active investor is to be judged. In fact, research shows that you’ll outperform most active investors the majority of the time. If that is your style, keep doing it.
But if you like investing and want to measure how well you’re really doing, this article is for you.
Plotting Your Portfolio Against the Market
Imagine graphing your portfolio returns against market returns (commonly represented by the S&P 500).
X-axis: Market return
Y-axis: Your portfolio return

Each little x represents a single point in time. For example, on one day the market may have lost 3% while your portfolio broke even (see the red arrow).
Once you plot all the points, you can draw a regression line—the line of best fit through the data. The equation looks like this:
Rp=α+βRm+ϵ
Rp = portfolio return
Rm = market return
Β (beta) = slope of the line
Α (alpha) = intercept (how far the line is above or below zero when the market’s return is zero)
ϵ (epsilon)= random noise that can’t be explained by the market
And here is the graph:
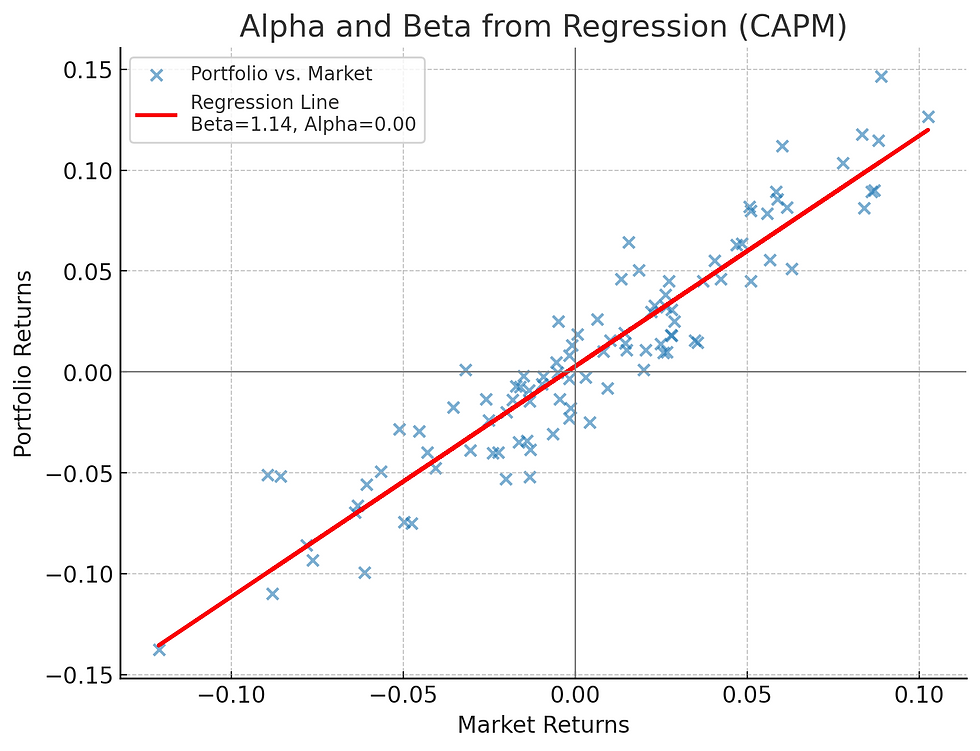
Don’t let the math intimidate you. What matters most are two things: alpha and beta.
What Beta Tells you: Risk
Beta measures your portfolio’s risk relative to the market.
A beta of 1.0 means you move in line with the market.
A beta of 1.2 means your portfolio is 20% more volatile.
A beta of 0.8 means it’s 20% less volatile.
Graphically, beta is simply the slope of the line.
What Alpha Tells You: Performance
Alpha measures your portfolio’s performance relative to what you’d expect given its beta.
Positive alpha: You earned more than expected.
Negative alpha: You underperformed relative to your risk.
Zero alpha: You did about as expected.
Important note: alpha is expressed in the same timeframe as your data. If you calculate returns monthly, then α = 0.02 means you outperformed by 2% per month (which compounds to much more on an annual basis). If you use annual data, α = 0.02 means 2% per year.
So always check the time period when interpreting alpha.
A Simple Metaphor
Think of it like this: If you are a runner and are trying to set a new personal record in a marathon, you look for the pacer who is holding the sign for the time that you want. That is beta. How far away you are from that pacer, either in front or behind, is your alpha.
Why Both Matter
When you are trying to evaluate how well you are performing as an investor, just looking at your rate for return and comparing it against the market does not give you the whole picture.
In investing, risk and return are tied together. If you are taking on more risk, you should expect a higher return because the company or fund that you are investing in should have to compensate you more for the higher probability of losing your money. Therefore, when you are judging returns it is always in the context of risk.
Beta is how you judge the risk. If your beta is higher than the market beta of 1.0, your returns should be comparably higher as well. How far away you are from the expected number is alpha.
Here’s the key: you can beat the market and still underperform as an investor.
Example: Say you have a beta of 1.2 and your portfolio beats the market by 10%. That might feel like a win—but you actually underperformed. Why? Because at 20% more risk, you should have done even better. That gap shows up as a negative alpha of 0.1.
My Wake-Up Call
I learned this lesson the hard way during the COVID run up and crash. My portfolio was doing great and beating the market handily. I thought I was a better investor than Waren Buffet. Then inflation spiked, Russia declared war on Ukraine, and the market cam crashing down. My portfolio got pummeled--and I felt like an idiot.
The reality was that I was neither brilliant nor stupid, I just wasn’t paying attention to risk. My portfolio had a high beta, which explained both the outsized gains and the painful losses. Once I understood that, I started monitoring my portfolio’s beta to be sure that my risk matched my goals.
How to Find Your Alpha and Beta
Many brokerage reports will calculate alpha and beta for you if you know where to find it. Look under the performance tab.
If not, you can do it in Excel by running a regression of your portfolio returns against the market if you have those skills.
For individual stocks and funds, you can look up beta easily on sites like Yahoo Finance.
When evaluating individual investments, use this simple rule of thumb:
If a fund has a beta higher than 1.0 but its long-term returns aren’t beating the S&P 500, you are not being compensated appropriately for risk, and you should reevaluate its place in your overall portfolio. (There may be other reasons that you keep the investment).
The Bottom Line
When you evaluate your portfolio, don’t stop at comparing your returns to the market.
Always ask: Did I earn an appropriate return for the risk I took?
Beta = your risk relative to the market.
Alpha = how much you outperformed (or underperformed) given that risk.
Understanding both will give you a far clearer picture of your performance as an investor.
If you’d like a portfolio review or want to see how your investments fit within a broader financial plan, reach out to me at bryan@targetedwealthsolutions.com. I’d be happy to discuss with you further about becoming a client.
Disclaimer: the material in this blog post is intended for general educational purposes only and should not be considered specific financial advice. You should always consult with your personal financial advisor to see how it might fit within your personalized financial plan.


Hey Bryan, nice article man. does small cap value have higher beta yet has had negative alpha? or is the extra risk that you take factor investing not really referred to as beta?